Biodegradability test results of tire rubber compounds in the ocean
May 20, 2025
There is concern that the dust generated by tire abrasion may be discharged into the ocean and become microplastics, thereby affecting the environment. Therefore, we compared and evaluated the biodegradability of rubber with cellulose nanofibers, cellulose particles, and biodegradable resin (PHBH) added to tire rubber compounds.
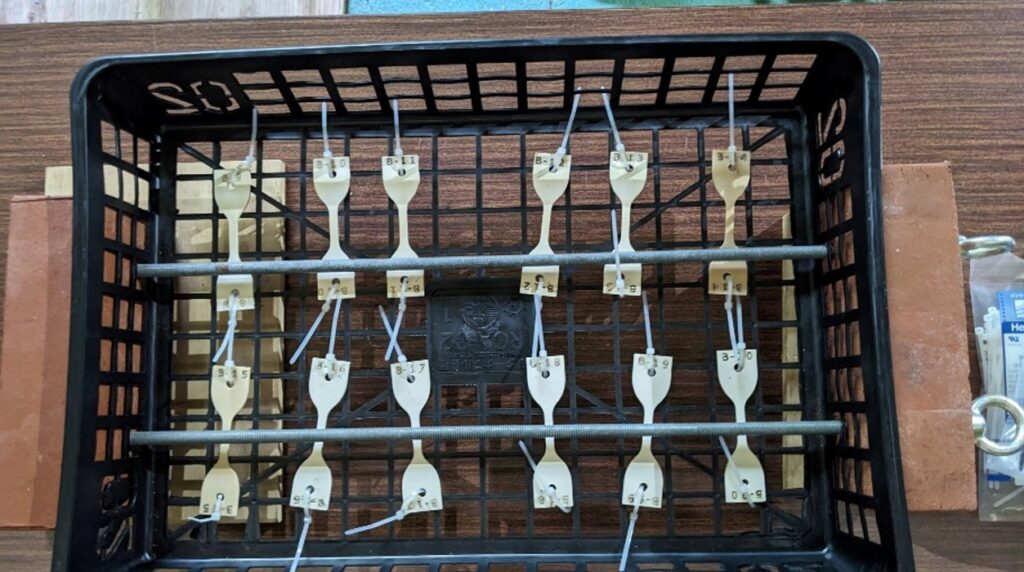
Biodegradability evaluation method for rubber dumbbells
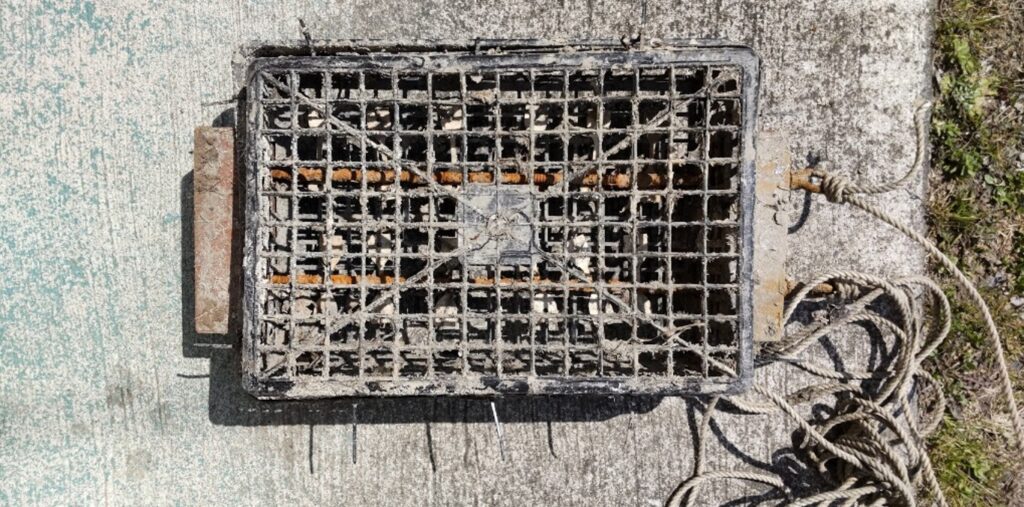
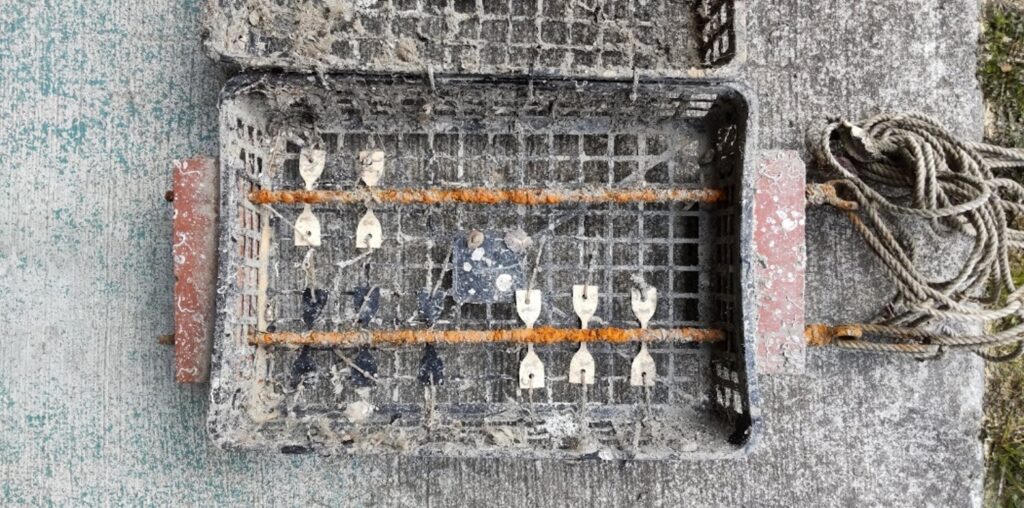
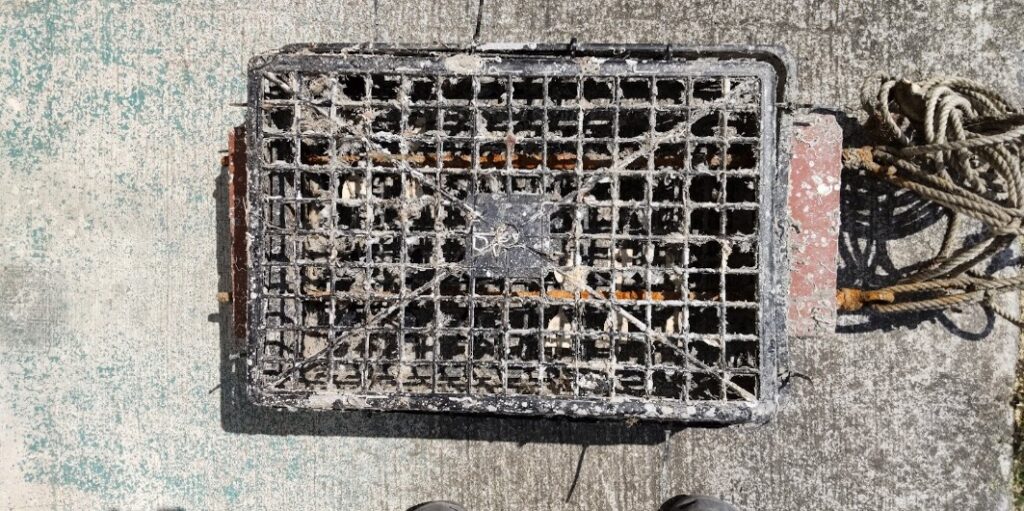
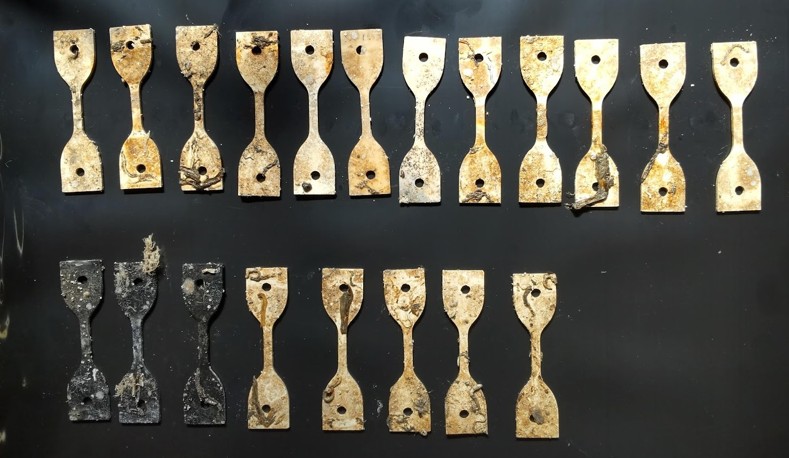
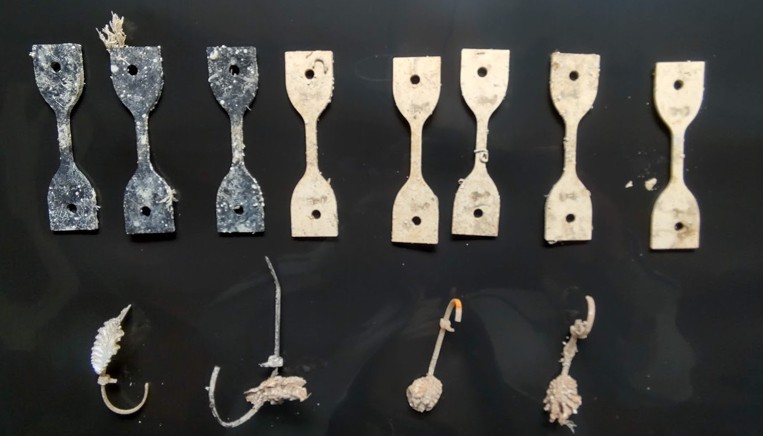
No. 3 dumbbells were fabricated using the prototype rubber compound and secured to the agricultural PP cage shown in the attached photo with PP bands. Brick weights were then attached to both sides and submerged in seawater at the Port of Shimizu to evaluate weight change and appearance!
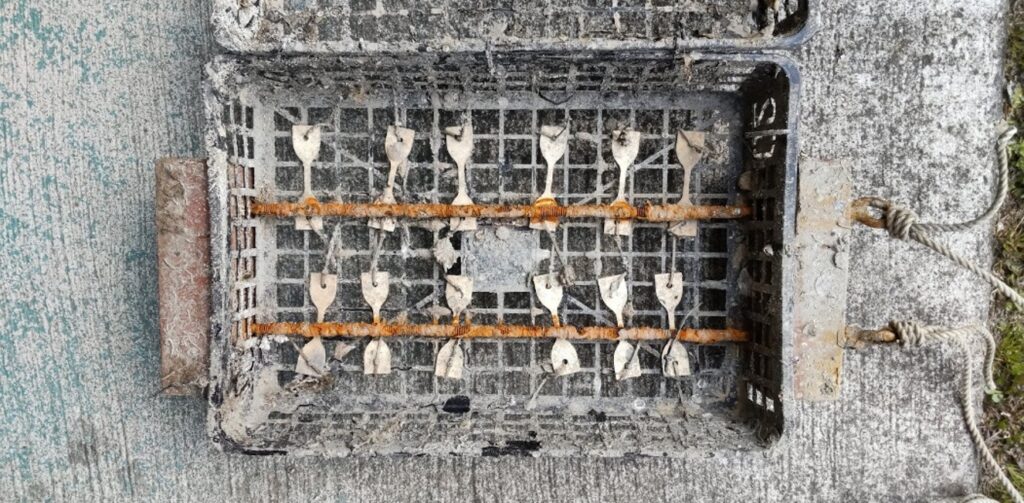
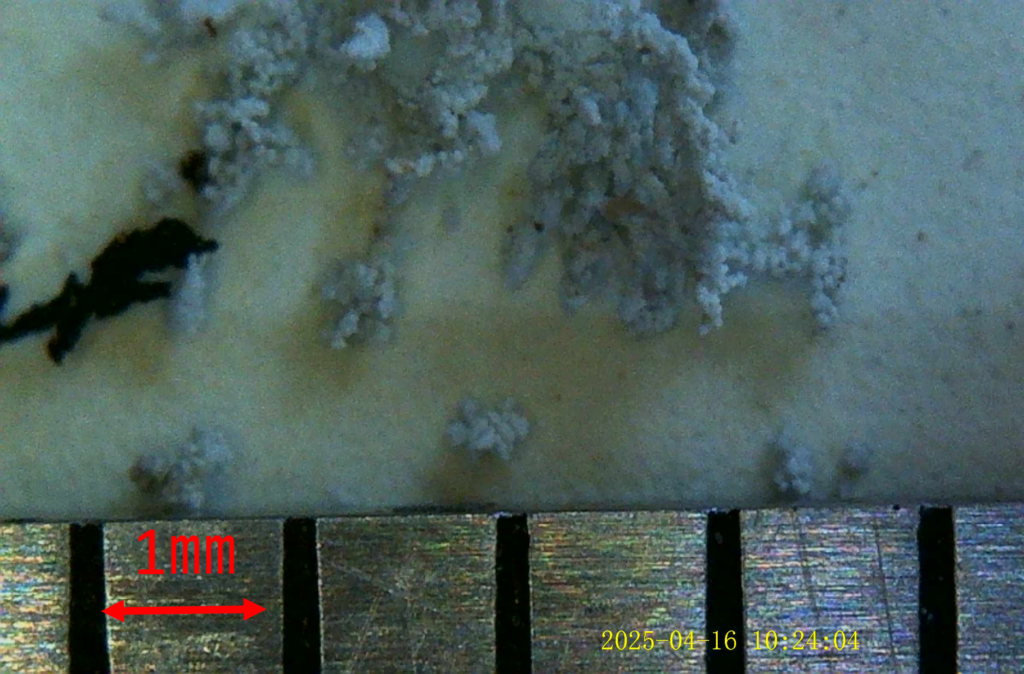
Photo after immersion
浸漬後写真
Photo after immersion
Date : 2024/8/7 – 2025/3/11 7 months
Location: Fujimi Pier, Fujimi No. 1 Quay, Fujimi Pier, 3-9 Kiyokai, Shimizu-ku, Shizuoka City, Shizuoka Prefecture, 424-0924, Japan
Apparatus: Consists of a PVC test case, polyethylene rope and weights
Size: 70 x 35 x 20 cm, weight 7-10 kg
Photo of biodegradable cage structure evaluation
総てのダンベルに海藻や貝が付着している。
ppバンドに付着した貝
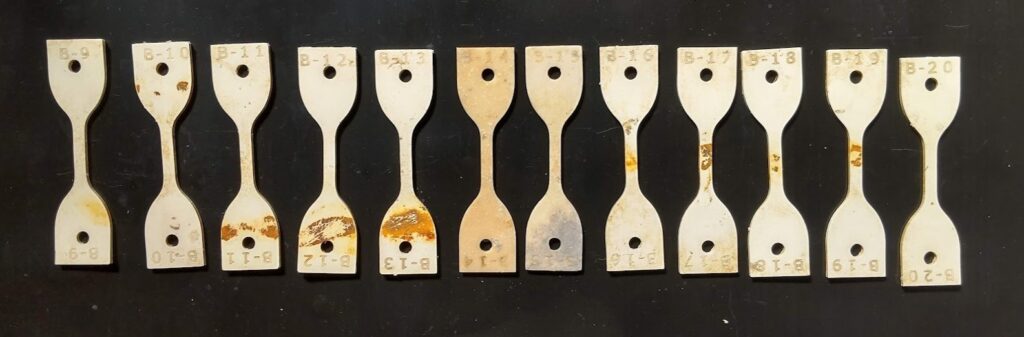
Trial Rubber Compound Composition
Compounding
B-9
B-10
B-11
B-12
B-13
B-14
B-15
B-16
B-17
B-18
B-19
B-20
Natural Rubber
60phr
60phr
60phr
60phr
60phr
60phr
60phr
60phr
60phr
60phr
60phr
60phr
Synthetic rubber
40phr
40phr
40phr
40phr
40phr
40phr
40phr
40phr
40phr
40phr
40phr
40phr
CNF dispersion resin
PE
PE
PE
PE
PHBH
PHBH
PHBH
–
–
Dispersants
–
–
Water-dispersed CNF
0
0.225phr
0.225phr
0.45phr
0
CNF
6phr
6phr
12phr
18phr
12phr
12phr
12phr
Colorants
Titanium dioxide 5 phr
Titanium dioxide 6 phr
Titanium dioxide 7 phr
Titanium dioxide 8 phr
Titanium dioxide 9 phr
Cellulose particles5phr
Cellulose particles5phr
Titanium dioxide 9 phr
Titanium dioxide 9 phr
Titanium dioxide 9 phr
Titanium dioxide 9 phr
Titanium dioxide 9 phr
Silica
44phr
44phr
44phr
44phr
44phr
44phr
44phr
45phr
45phr
45phr
45phr
45phr
Vulcanizing agent
Sulphur
Sulphur
Sulphur
Sulphur
Sulphur
Sulphur
Vulcanizing peroxide
Sulphur
Sulphur
Sulphur
Sulphur
Sulphur
Results of experiments
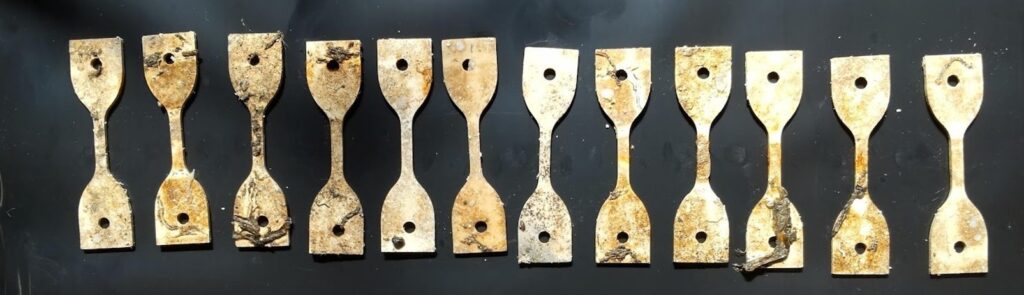
Weight change and rate of weight change of No. 3 dumbbells lightly rinsed after immersion in Shimizu Port for 7 months
Prototype NO.
B-9
B-10
B-11
B-12
B-13
B-14
B-15
B-16
B-17
B-18
B-19
B-20
Weight before test (g)
4.28
4.42
4.47
4.59
4.6
4.35
4.3
4.2
4.35
4.4
4
4.06
Weight after test (g) Lightly rinsed product
4.19
4.31
4.44
4.57
4.51
4.24
4
4.15
4.26
4.33
4
3.97
Weight change (g)
-0.09
-0.11
-0.03
-0.02
-0.09
-0.11
-0.3
-0.05
-0.09
-0.07
0
-0.09
Weight change (%)
-2.10%
-2.50%
-0.70%
-0.40%
-2.00%
-2.50%
-7.00%
-1.20%
-2.10%
-1.60%
0.00%
-2.20%
Weight change and rate of weight change of No. 3 dumbbells cleaned of seaweed and shellfish attached to the surface
Prototype NO.
B-9
B-10
B-11
B-12
B-13
B-14
B-15
B-16
B-17
B-18
B-19
B-20
Weight after test (g) *
4.13
4.22
4.31
4.45
4.43
4.17
3.97
4.01
4.17
4.22
3.79
3.88
Weight change (g)
-0.15
-0.2
-0.16
-0.14
-0.17
-0.18
-0.33
-0.19
-0.18
-0.18
-0.21
-0.18
Weight change (%)
-3.50%
-4.50%
-3.60%
-3.10%
-3.70%
-4.10%
-7.70%
-4.50%
-4.10%
-4.10%
-5.30%
-4.40%
*After rinsing with a kitchen sponge and drying at room temperature for 2 days
Weight change of dumbbells after heat treatment at 110°C for 2 hours
Prototype NO.
B-9
B-10
B-11
B-12
B-13
B-14
B-15
B-16
B-17
B-18
B-19
B-20
Weight after test (g)**
4.02
4.16
4.19
4.32
4.3
4.02
3.79
3.97
4.03
4.13
3.71
3.8
Weight change (g)
-0.11
-0.06
-0.12
-0.13
-0.13
-0.15
-0.18
-0.04
-0.14
-0.09
-0.08
-0.08
Weight change (%)
-2.70%
-1.40%
-2.80%
-2.90%
-2.90%
-3.60%
-4.50%
-1.00%
-3.40%
-2.10%
-2.10%
-2.10%
**Wash with water using a kitchen sponge, dry at room temperature for 2 days, then dry at +110°C for 2 hours.
Results of moisture absorption measurement after leaving the room
Prototype NO.
B-9
B-10
B-11
B-12
B-13
B-14
B-15
B-16
B-17
B-18
B-19
B-20
Weight after test (g)**
4.02
4.17
4.2
4.34
4.33
4.02
3.81
3.98
4.03
4.15
3.74
3.8
Weight change (g)
0
0.01
0.01
0.02
0.03
0
0.02
0.01
0
0.02
0.03
0
Weight change due to moisture absorption (%)
0.00%
0.20%
0.20%
0.50%
0.70%
0.00%
0.50%
0.30%
0.00%
0.50%
0.80%
0.00%
Weight change of test sample stored at room temperature after heat treatment at 110°C for 2 hours
Prototype NO.
B-9
B-10
B-11
B-12
B-13
B-14
B-15
B-16
B-17
B-18
B-19
B-20
Weight after test (g) Before drying at 110°C for 2 hours
4.44
4.37
4.54
4.45
4.25
4.29
4.22
4.48
4.63
4.38
4.42
4.47
Weight after test (g) After drying at 110°C for 2 hours Weight after storage at room temperature for 24 hours
4.34
4.24
4.39
4.32
4.13
4.16
4.03
4.34
4.5
4.25
4.3
4.35
Weight change (g)
-0.1
-0.13
-0.15
-0.13
-0.12
-0.13
-0.19
-0.14
-0.13
-0.13
-0.12
-0.12
Weight change (%)
-2.30%
-3.00%
-3.30%
-2.90%
-2.80%
-3.00%
-4.50%
-3.10%
-2.80%
-3.00%
-2.70%
-2.70%
Photograph of sample after heat treatment at 110°C for 2 hours for the test sample stored at room temperature
Comparison of weight loss of test sample stored at room temperature and No. 3 dumbbell immersed in seawater for 7 months by heating at 100°C for 2 hours
Prototype NO.
B-9
B-10
B-11
B-12
B-13
B-14
B-15
B-16
B-17
B-18
B-19
B-20
Weight after test (g)**
4.02
4.16
4.19
4.32
4.3
4.02
3.79
3.97
4.03
4.13
3.71
3.8
Weight change (g)
-0.11
-0.06
-0.12
-0.13
-0.13
-0.15
-0.18
-0.04
-0.14
-0.09
-0.08
-0.08
Weight change (%)
-2.70%
-1.40%
-2.80%
-2.90%
-2.90%
-3.60%
-4.50%
-1.00%
-3.40%
-2.10%
-2.10%
-2.10%
Prototype NO.
B-9
B-10
B-11
B-12
B-13
B-14
B-15
B-16
B-17
B-18
B-19
B-20
Weight after test (g) Before drying at 110°C for 2 hours
4.44
4.37
4.54
4.45
4.25
4.29
4.22
4.48
4.63
4.38
4.42
4.47
Weight after test (g) After drying at 110°C for 2 hours Weight after storage at room temperature for 24 hours
4.34
4.24
4.39
4.32
4.13
4.16
4.03
4.34
4.5
4.25
4.3
4.35
Weight change (g)
-0.1
-0.13
-0.15
-0.13
-0.12
-0.13
-0.19
-0.14
-0.13
-0.13
-0.12
-0.12
Weight change (%)
-2.30%
-3.00%
-3.30%
-2.90%
-2.80%
-3.00%
-4.50%
-3.10%
-2.80%
-3.00%
-2.70%
-2.70%
B-9
B-10
B-11
B-12
B-13
B-14
B-15
B-16
B-17
B-18
B-19
B-20
Samples immersed in seawater for 7 months
-2.70%
-1.40%
-2.80%
-2.90%
-2.90%
-3.60%
-4.50%
-1.00%
-3.40%
-2.10%
-2.10%
-2.10%
Samples stored at room temperature
-2.30%
-3.00%
-3.30%
-2.90%
-2.80%
-3.00%
-4.50%
-3.10%
-2.80%
-3.00%
-2.70%
-2.70%
Seawater sample – room temperature sample
-0.40%
1.60%
0.50%
0.00%
-0.10%
-0.60%
0.00%
2.10%
-0.60%
0.90%
0.60%
0.60%
The weight loss of samples immersed in seawater and those stored at room temperature were found to be almost the same when heated at 100°C for 2 hours, respectively.
Weight change of dried product at room temperature after immersion in 500g seawater at room temperature for 7 days and rinsing of test sample stored at room temperature
Prototype NO.
B-9
B-10
B-11
B-12
B-13
B-14
B-15
B-16
B-17
B-18
B-19
B-20
Weight after test (g)
4.25
4.34
4.33
4.59
4.27
4.2
4.02
4.51
4.58
4.43
4.39
4.5
Weight after test (g)**
4.26
4.4
4.34
4.62
4.35
4.27
4.03
4.56
4.62
4.48
4.53
4.41
Weight change (g)
0.01
0.06
0.01
0.03
0.08
0.07
0.01
0.05
0.04
0.05
0.14
-0.09
Weight change (%)
0.20%
1.40%
0.20%
0.70%
1.90%
1.70%
0.20%
1.10%
0.90%
1.10%
3.20%
-2.00%
*Before drying at 110°C for 2 hours.
**Weight after drying at 110°C for 2 hours and storing at room temperature for 24 hours.
Samples immersed in seawater for 7 days showed a tendency to increase in weight and no leaching was observed.
Relationship between biodegradability rates of PE-treated CNF, PHBH-treated CNF, and cellulose particle addition
A trend of decreasing biodegradability rate was observed as the amount of PE-treated CNF added increased.
*After washing with water using a kitchen sponge and drying at room temperature for 2 days
Prototype NO.
B-10
B-11
B-12
Weight after test (g) * Weight change after test (g)
4.22
4.31
4.45
Weight change (g)
-0.2
-0.16
-0.14
Weight change (%)
-4.50%
-3.60%
-3.10%
PE-treated CNF
6phr
12phr
18phr
No significant difference in biodegradability rates due to PHBH-treated CNF was found.
Prototype NO.
B-13
Weight after test (g)
4.43
Weight change (g)
-0.17
Weight change (%)
-3.70%
PHBH-treated CNF
12phr
B-14 with 5 parts of CNF particles showed an increase in biodegradability rate.
Prototype NO.
B-14
Weight after test (g)*
4.17
Weight change (g)
-0.18
Weight change (%)
-4.10%
PHBH-treated CNF + CNF particles
12phr+5phr
Biodegradability has been greatly improved by changing the vulcanization method to peroxide vulcanization.
Prototype NO.
B-15
Weight after test (g)*
3.97
Weight change (g)
-0.33
Weight change (%)
-7.70%
PHBH-treated CNF + CNF particles
12phr + 5phr + peroxide vulcanization
Prototypes B-16 to B-20 with CNF additions of 0 to 0.45 parts had almost the same biodegradation rate as B-10.
Prototype NO.
B-16
B-17
B-18
B-19
B-20
Weight after test (g)*
4.01
4.17
4.22
3.79
3.88
Weight change (g)
-0.19
-0.18
-0.18
-0.21
-0.18
Weight change (%)
-4.50%
-4.10%
-4.10%
-5.30%
-4.40%
Water-dispersed CNF
0
0.225phr
0.225phr
0.45phr
0
Considerations
Estimation of 100% biodegradation months by comparing the surface area of 0.1 mm tire wear dust to that of No. 3 dumbbells
Sample
Weight(g)
Thickness(cm)
Length(cm)
Width(cm)
Specific gravity
Weight(g)
Surface arer(㎠)
Total surface area(㎠)
No. 3 dumbbell surface area comparison
No. 3 dumbbell
4.13
0.2
10
1.83
1.13
4.14
22.6
4
0.73
27.33
Sample
Weight(g)
Thickness(cm)
Length(cm)
Width(cm)
Specific gravity
Weight(g)
Surface arer(㎠)
Total surface area(㎠)
No. 3 dumbbell surface area comparison
0.1 mm tire wear dust
4.13
0.01
0.01
0.01
1.13
0
6070554
0.00031
1,906.15
69.74
The volume of the sphere is 4/3πr³ (4/3 × circumference × radius³) and its surface area is 4πr² (4 × circumference × radius²).
Number of months of biodegradation of tire wear dust in seawater
B-9
B-10
B-11
B-12
B-13
B-14
B-15
B-16
B-17
B-18
B-19
B-20
Weight change of No. 3 dumbbell after immersion in seawater for 7 months
-0.15
-0.2
-0.16
-0.14
-0.17
-0.18
-0.33
-0.19
-0.18
-0.18
-0.21
-0.18
Surface area equivalent multiple of 0.1 mm tire wear dust particles
69.7
69.7
69.7
69.7
69.7
69.7
69.7
69.7
69.7
69.7
69.7
69.7
Number of months of 100% biodegradation of No. 3 dumbbell sample
-199.7
-154.7
-195.6
-229.5
-189.4
-169.2
-91.2
-154.7
-169.2
-171.1
-133.3
-157.9
Estimated number of months of 100% biodegradation in terms of surface area
-2.9
-2.2
-2.8
-3.3
-2.7
-2.4
-1.3
-2.2
-2.4
-2.5
-1.9
-2.3
Vulcanizing agent
Sulphur
Sulphur
Sulphur
Sulphur
Sulphur
Sulphur
Vulcanizing peroxide
Sulphur
Sulphur
Sulphur
Sulphur
Sulphur
CNF Treatment agent
PE
PE
PE
PE
PHBH
PHBH
PHBH
Colorants
Titanium dioxide 5 phr
Titanium dioxide 6 phr
Titanium dioxide 7 phr
Titanium dioxide 8 phr
Titanium dioxide 9 phr
Cellulose particles5phr
Cellulose particles5phr
Titanium dioxide 9 phr
Titanium dioxide 9 phr
Titanium dioxide 9 phr
Titanium dioxide 9 phr
Titanium dioxide 9 phr
Tire wear dust
Points
(i) After immersing samples B-9 to B-20 in ocean water for 7 months and removing attached seaweeds and shells, the weight change of No. 3 dumbbells ranged from -3.1% to -7.7%. (ii) Dumbbells immersed in seawater for 7 months and dried at 110°C for 2 hours showed a weight loss of -1.00% to -4.5%. This weight loss is considered to be due to volatile components inside the rubber and moisture. (iii) When dumbbells were immersed in seawater and then dried at 110°C for 2 hours and left indoors, the weight gain due to moisture absorption ranged from 0% to 0.8%, which was small compared to the weight loss due to the drying process. (iv) When rubber sheets not immersed in seawater were dried at 110°C for 2 hours, a weight change of -2.3% to -4.5% was observed. This is almost the same level as that of the sample immersed in seawater, and it is considered that volatile components are not lost in seawater. (5) When rubber samples stored at room temperature were immersed in salt water for 7 days and then dried at room temperature, a weight gain of 0% to 0.8% was observed. This result indicates that there are no components that leach out in the salt water. ⑥ Based on the above results, the weight loss of the No. 3 dumbbell immersed in the ocean for 7 months is estimated to be due to biodegradation. ⑦ The standard sample of No. 3 dumbbells made of 60 parts natural rubber and 40 parts synthetic rubber with titanium dioxide as a colorant showed 4.5% biodegradation in 7 months. (viii) No. 3 dumbbells with 6, 12, and 18 parts of CNF dispersed in PE showed a trend of decreasing biodegradability as the amount of CNF added increased. (ix) The biodegradability of B-13 to which 12 parts of CNF dispersed in PHBH were added was equivalent to that of B-11, a PE-dispersed CNF product, and no effect of the biodegradable resin PHBH was observed. (10) The biodegradation rate of prototype B-14, in which titanium dioxide was changed to cellulose particles as a coloring agent, was improved by about 10%. (11) Biodegradation rate of B-15 with peroxide vulcanization was -7.7%, which was slightly higher than that of other prototypes. ⑫ Since the biodegradation rate is estimated to depend on surface area, the surface area of No. 3 dumbbells was compared with that of tire wear dust (0.1 mm in diameter), and it was found that the wear dust had a surface area about 70 times larger than that of dumbbells. ⑬ If a B-10 standard compound rubber sample becomes 0.1 mm tire wear dust, it is estimated to decompose 100% in 2.2 months. ⑭ If a B-15 peroxide vulcanized rubber sample becomes 0.1 mm tire wear dust, it is estimated to decompose 100% in 1.3 months.
Acknowledgements
This research project was supported by the Marine Industry Cluster Council of Shizuoka City. Thank you very much for your cooperation.